AI-Powered Microsoft Power BI Course in Lahore

The ISDI Power BI for Data Analyst program is a practical, job-oriented training course covering data connectivity, Power Query, data modeling, DAX, advanced analysis, visualization, Power BI Service, security, Microsoft Fabric, AI-assisted analysis, and an end-to-end business intelligence project.

Power BI
MS Excel
database
Claude
ChatGPT
Power BI
MS Excel
database
Claude
ChatGPT
Power BI
MS Excel
database
Claude
ChatGPT

What makes this Power BI Course Special

Learn practical Power BI and Data Analytics skills through hands-on training, real business datasets, advanced DAX, interactive dashboards, and AI-assisted analysis designed to help you build job-ready data skills.

AI-Integrated Power BI Course

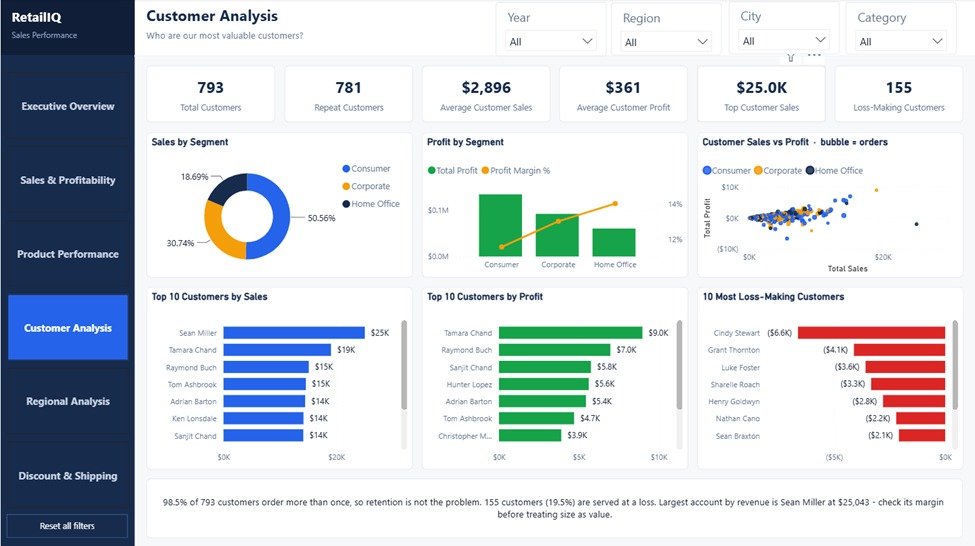
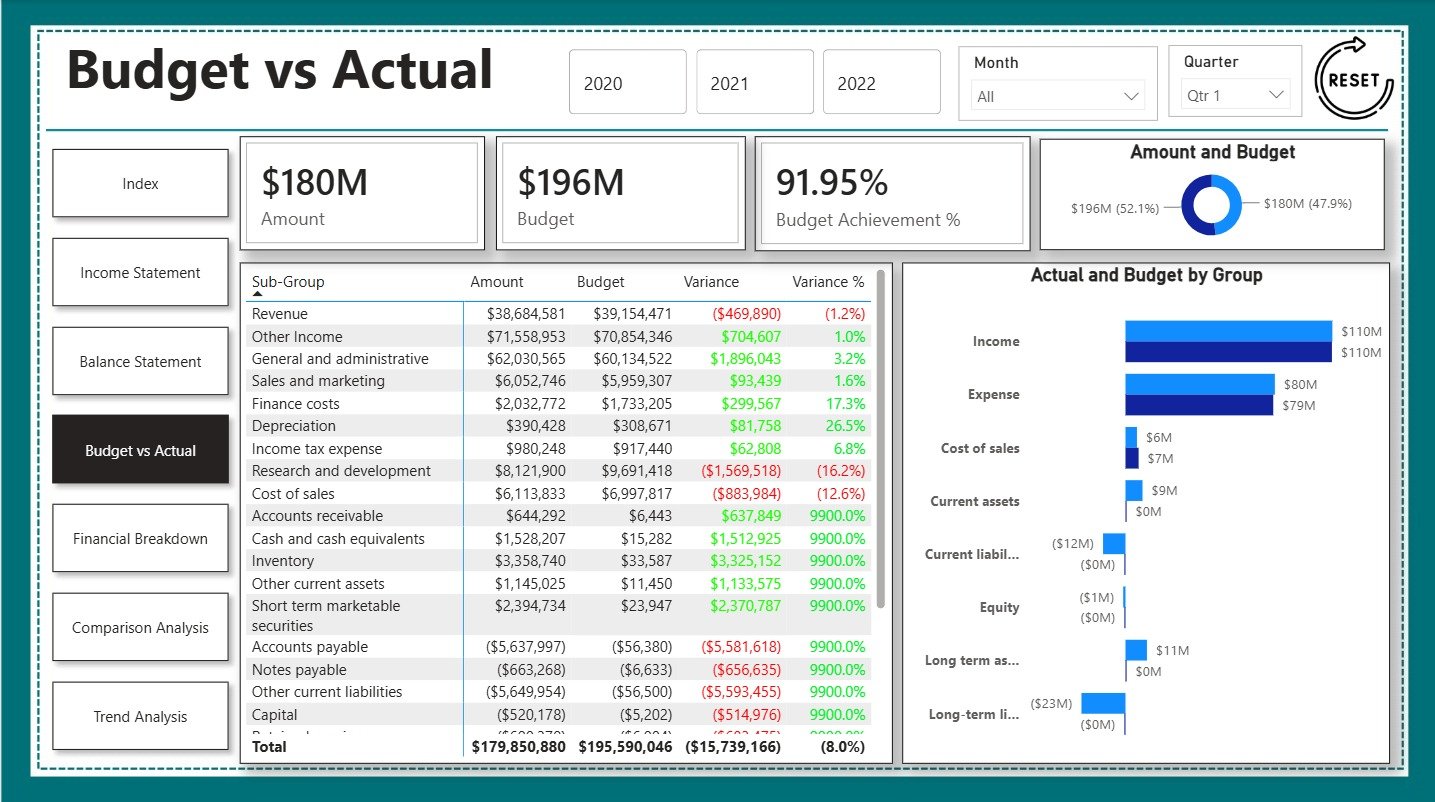
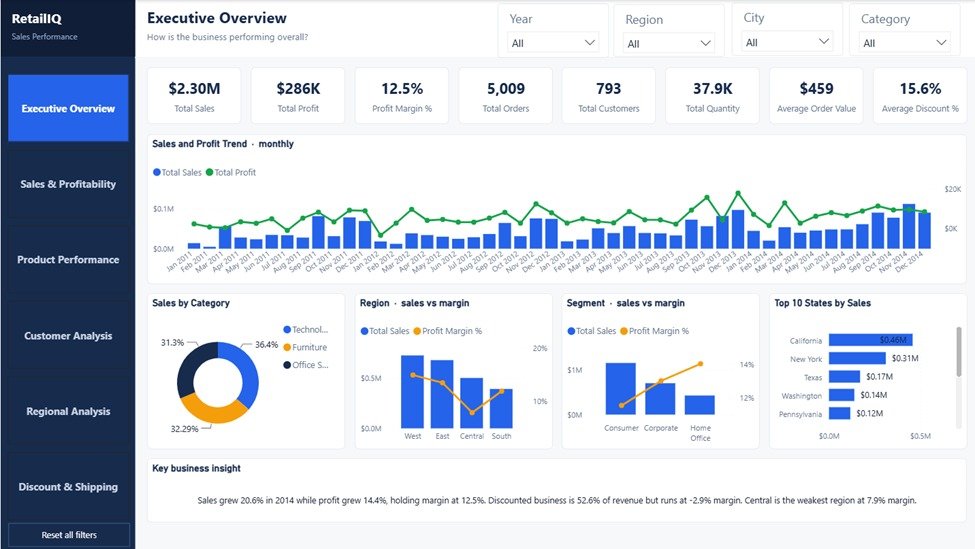
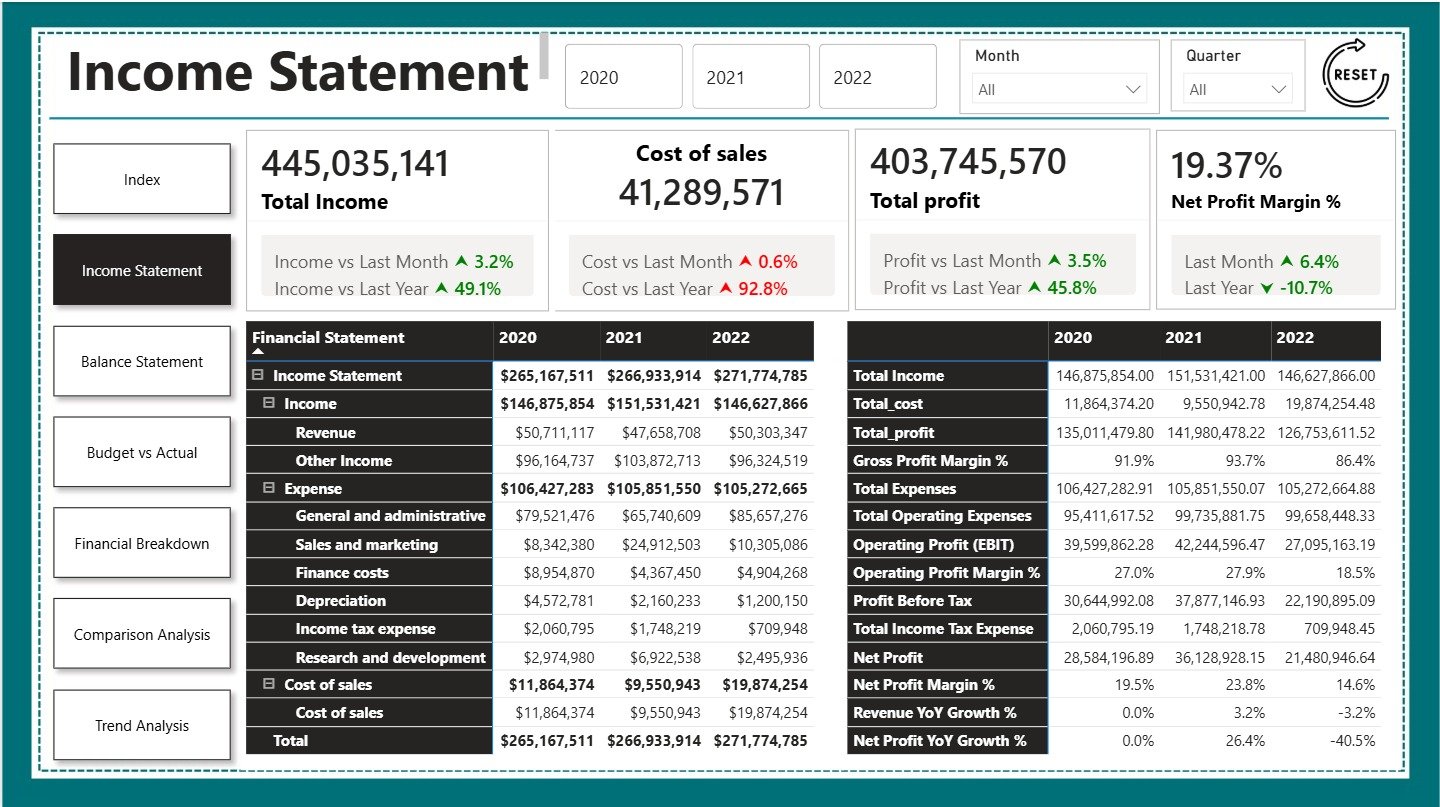
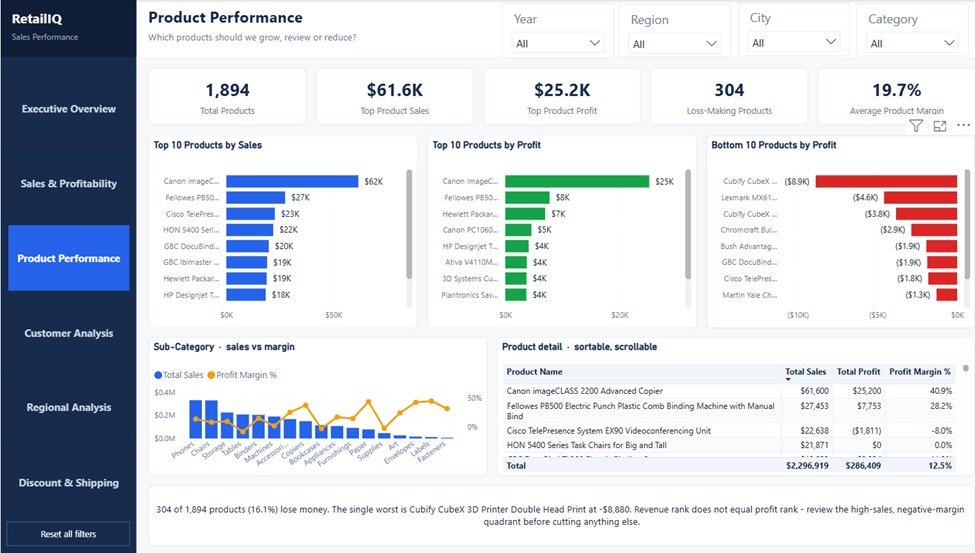
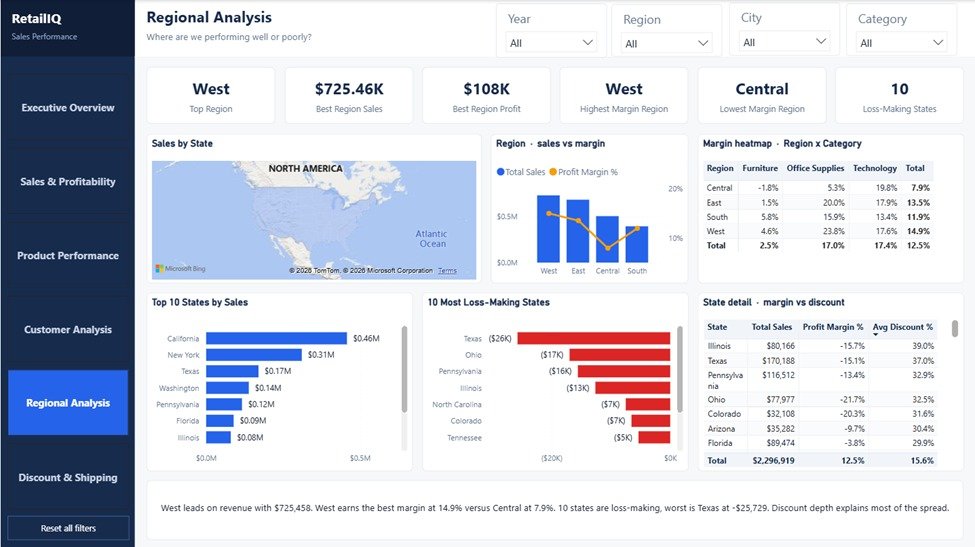
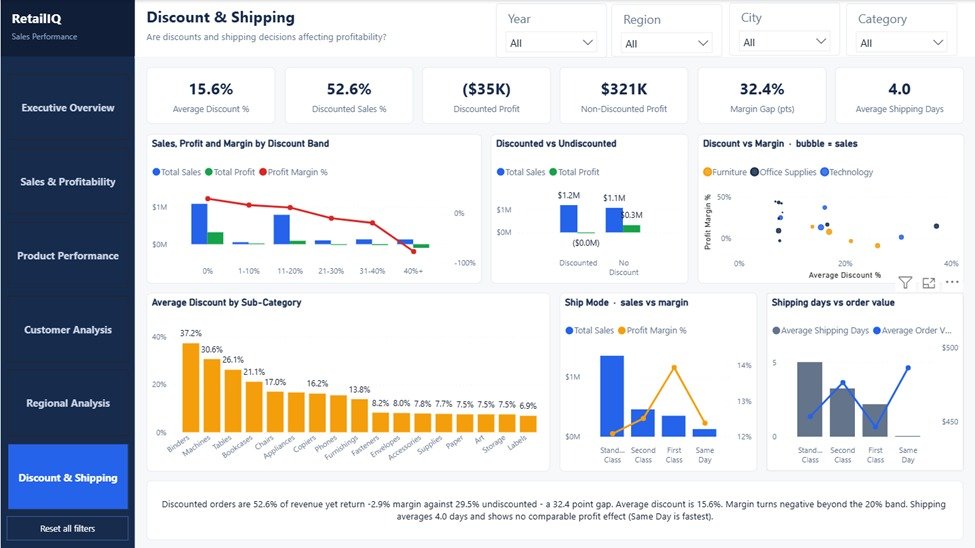
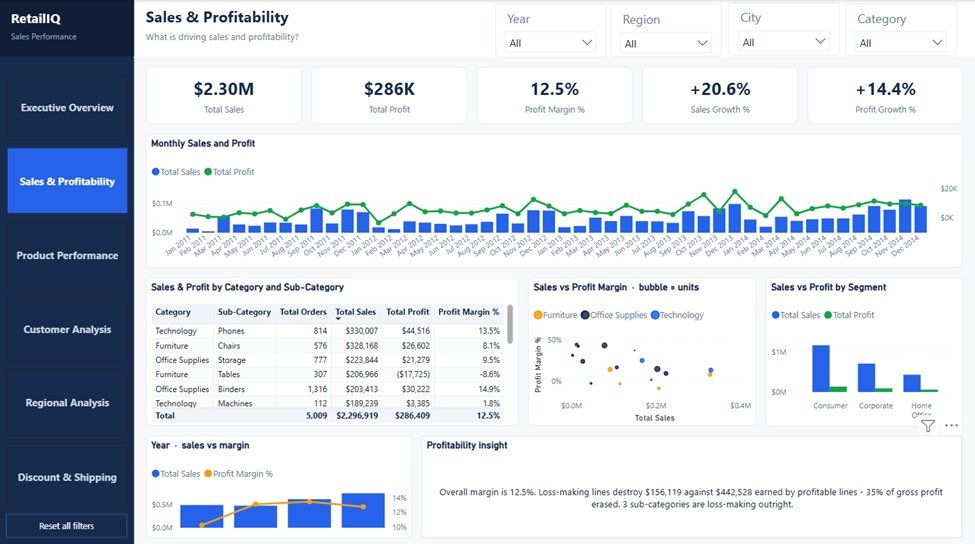
A detailed overview of our Power BI course, covering data connectivity, Power Query, data cleaning, data modeling, DAX, advanced analytics, dashboard design, Power BI Service, security, Microsoft Fabric, and AI-assisted analysis.

What You’ll Gain From This Power BI Course

Learn how to turn raw data into clear insights, interactive dashboards, and business intelligence solutions using Power BI. Build practical skills in data cleaning, modeling, DAX, visualization, reporting, and AI-assisted analytics.

Class 1 — Introduction to Power BI & Data Connectivity
  • Explain Power BI and its role in modern data analytics and business intelligence.
  • Describe the Power BI ecosystem: Desktop, Service, Power Query, Data Modeling, DAX, reports and dashboards.
  • Navigate Power BI Desktop including Report, Data and Model views.
  • Connect Power BI to common data sources(Excel, CSV, Folder, Data base and more)
  • Differentiate Import and DirectQuery at a practical level.
  • Explain ETL and the role of Power Query in the Power BI workflow.
  • Profile datasets and identify errors, nulls, duplicates and inconsistent formats.
  • Apply common cleaning and transformation operations.
  • Merge related tables using business keys.
  • Append datasets with compatible structures.
  • Understand the role of Applied Steps and basic M language.
  • Explain analytical data modeling and why model design affects report quality.
  • Identify fact and dimension tables.
  • Design a Star Schema, Snowflake and other.
  • Create primary/foreign key relationships.
  • Understand cardinality and cross-filter direction.
  • Create a Date/Calendar table.
  • Understand active/inactive relationships and role-playing date concepts.
  • Apply basic model optimization.
  • Data normalization vs
  • Explain DAX and its role in the semantic model.
  • Differentiate calculated columns, measures and calculated tables.
  • Understand basic row context and filter context.
  • Create reusable measures using aggregation functions.
  • DAX calculation and formula.

Create business KPIs and format measures professionally.

  • Explain how CALCULATE modifies filter context.
  • Use FILTER, ALL, ALLEXCEPT, REMOVEFILTERS and VALUES appropriately.
  • Use Business Rules with IF and SWITCH for dynamic analysis.
  • Create percentage, variance, Budget vs Actual and contribution measures.
  • Apply time-intelligence patterns for YTD, MTD ,Running Totals, prior year and growth.
  • Rank products/customers/regions using RANKX.
  • Apply principles of effective data visualization.
  • Choose visuals based on analytical purpose.
  • Bar and Column Charts, Line and Area Charts, Pie and Donut Charts ,Cards and KPI Visuals, Tables and Matrices, Maps, Slicers and Filters
  • Build executive KPI sections and trend visuals.
  • Create interactive slicers, drill-down and drill-through.
  • Use tooltips, conditional formatting, bookmarks and buttons.
  • Design a coherent multi-page report with business storytelling.
  • Power BI integration with AI model.
  • Power BI Desktop vs Power BI Service and Publishing Reports
  • Understand semantic models, reports and dashboards in the Service.
  • Understand refresh.
  • Explain sharing, apps and workspace roles.
  • Create and test basic Regional Row-Level Security.
  • Explain Microsoft Fabric and its relationship with Power BI.
  • Describe OneLake, Lakehouse, Warehouse, Data Factory and semantic models.
  • Understand the high-level Fabric-to-Power BI data workflow.
  • Understand Direct Lake at an introductory level.
  • Use AI-assisted analysis to generate summaries, trends and recommendations.
  • Validate AI-generated insights against Power BI results.
  • Present an end-to-end business intelligence solution.

Designed for Growth

Why the ISDI Power BI Course stands out for students and professionals looking to build practical data analytics skills.

P

Practical

Learn through real-world datasets, data analysis, dashboard building, and hands-on Power BI projects.

L

Live

Learn through interactive classes with instructor-led guidance and practical demonstrations.

A

Applied

Apply Power BI skills to real business data, reporting, analytics, and decision-making scenarios.

C

Career

Build job-ready data analytics skills for Data Analyst, Business Intelligence, and reporting roles.

E

Analytics

Learn data visualization, DAX, KPIs, dashboards, and AI-assisted analysis to turn data into actionable insights.

Meet Your Mentors

Take a closer look at Mentors who've been there and done that!

Amir Rehman Power BI trainer
Amir Rehman
Business & Data Analyst
Ahsan Shabbir
Business & Data Analyst

Talk to us in-person

Get the ISDI Campus Experience

ISDI Canal Bank Campus

ISDI Ghalib Market Campus

Fee structure of this program

Premium educational pricing with exclusive early-bird benefits

Total Program Fee:

Rs.26,000/-

Rs.20,000/-

Real Results from Real Students

Real Results from

Real feedback from learners who experienced skill-focused training at ISDI.

Get Certified & Stand Out

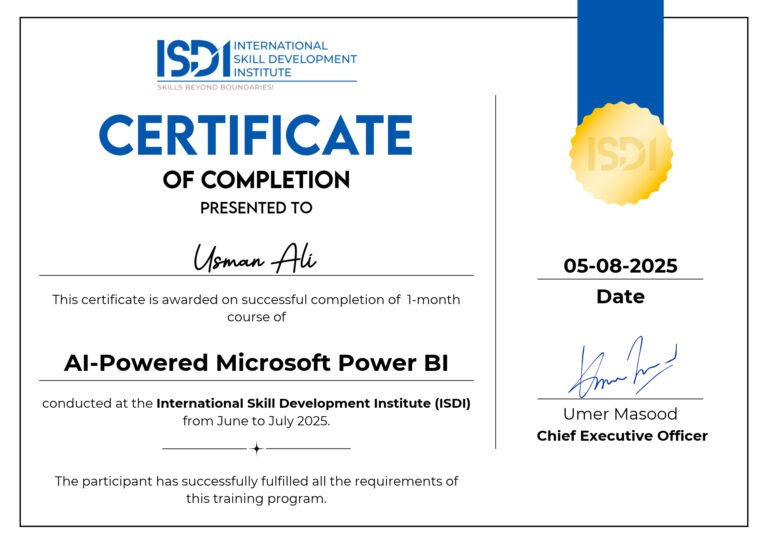
Upon successful completion of the Power BI for Data Analyst Course, receive an ISDI certificate that recognizes your course completion and demonstrates your practical training in Power BI and data analytics.

FAQs about Power BI Course

Get your every question answered here.

Is the Power BI course fully onsite?

Yes. The Microsoft Power BI Course is fully onsite, with physical classes held Saturday and Sunday at ISDI’s campus in Lahore. Students learn through classroom-based training, practical activities, and a structured 4-week curriculum.

The program is 1 months, with classes held on Saturday and Sunday. Each class is 3 hours.

You can apply online through the ISDI website or contact our admissions team directly on +92 332 3473475 for enrollment and further details.

This course is suitable for:

  • Aspiring Data Analysts
  • Business Analysts
  • Finance & Business Professionals
  • Students
  • Working Professionals
  • Professionals looking to move into Data & Business Intelligence roles

No. Previous Power BI experience is not required. Basic knowledge of computers and Excel is recommended but not mandatory.

You will learn data connectivity, Power Query, data cleaning, data modeling, DAX, advanced analytics, dashboard design, Power BI Service, basic security, Microsoft Fabric, and AI-assisted analysis.

Yes. Students receive an ISDI physical certificate.

A laptop is recommended so you can practice Power BI, work with datasets, build dashboards, and complete course projects during your training.

Yes. Regular attendance is important, particularly for your learning progress and career growth assistance eligibility. If you need to miss a class, inform your program manager in advance.

Are You Ready to Turn Data Into Insights?

Learn practical Power BI skills and transform raw data into powerful dashboards, reports, and business insights.